This tutorial shows how to use various modes of the STM32 ADCs, including:
- Basic single-channel measurement
- Use of interrupts
- DMA
- Multi-channel sequences
Before you begin, install VisualGDB 5.0 or later and ensure you are using the latest version of the STM32 BSP.
An ADC (Analog-to-Digital Converter) is a peripheral that allows measuring the voltage (between 0 and Vref) on a certain input of the microcontroller and converting it into a number between 0 and 2N-1 where N is the ADC resolution. The easiest way to experiment with an ADC is to connect it to a potentiometer – a mechanically adjustable resistor: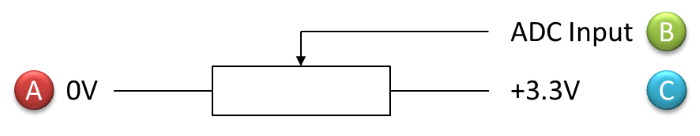 If you connect one of the side terminals of the potentiometer to the GND pin on your board and the other one to the VCC pin, rotating the potentiometer knob will gradually change the voltage level (relative to ground) on the third pin between 0 and VDD, that should produce values from 0 to 4095 for a 12-bit ADC.
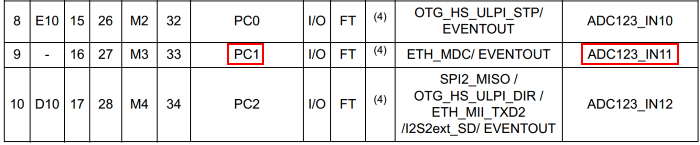
In this tutorial we will use the STM32F4Discovery board with the STM32F407VG microcontroller that has several ADC inputs. We will use the PC1 pin connected to channel 11 of ADCs 1-3 according to the STM32F407xx datasheet:
 The connected potentiometer will look like this:
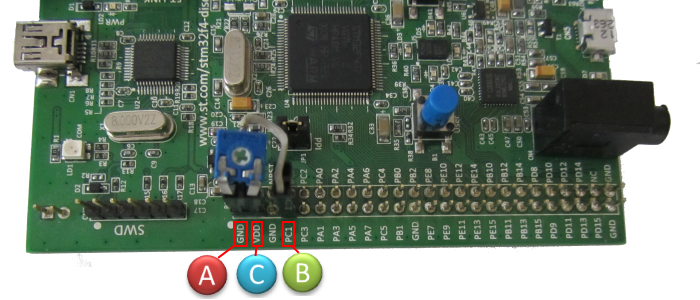 Now we will start writing the software to experiment with different ADC modes.
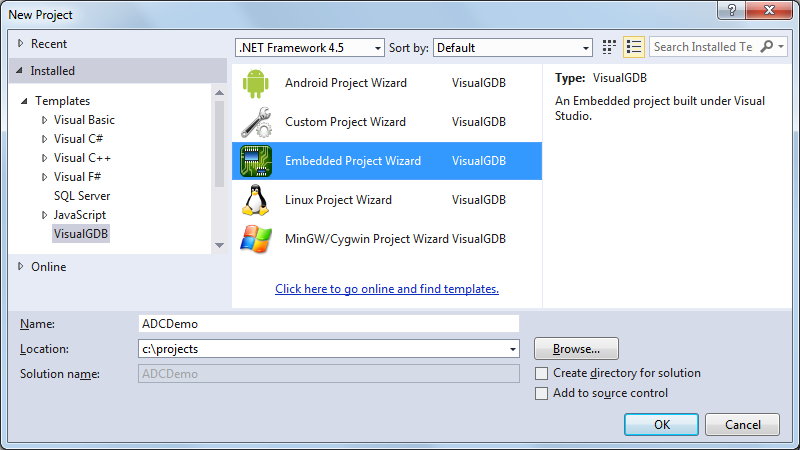
- Start Visual Studio and begin creating a new project with VisualGDB Embedded Project Wizard:
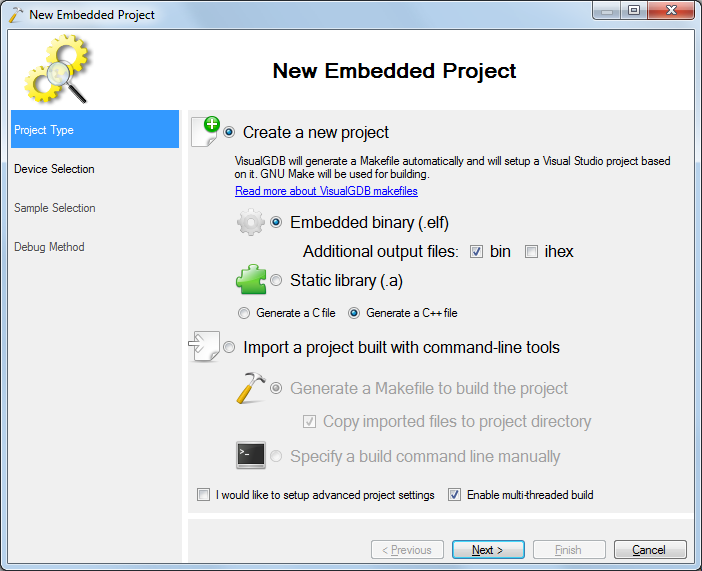
- Select “Create a new project” on the first page the wizard:
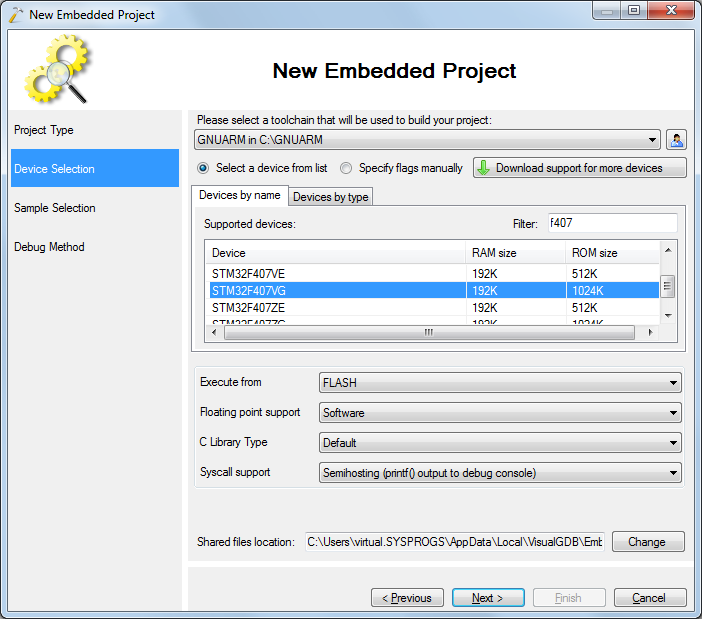
- Select your device on the next page. In this example we are using STM32F407VG:
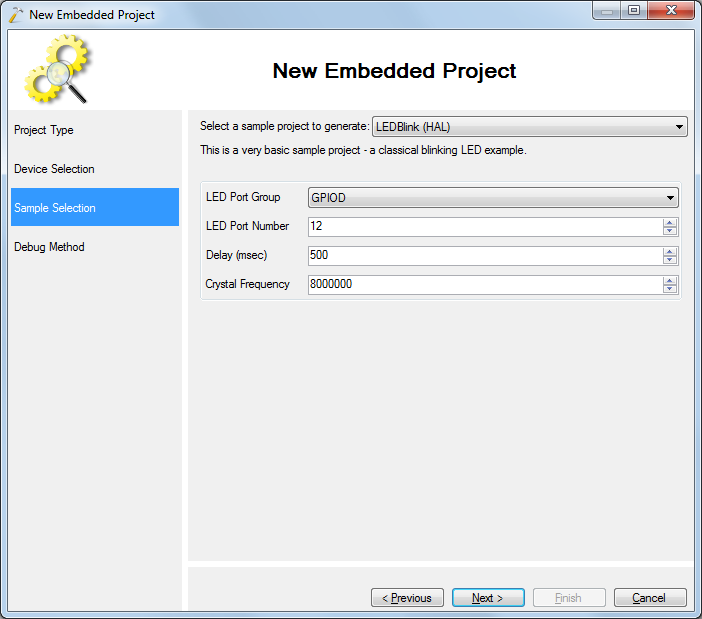
- Continue with the default “LEDBlink (HAL)” sample:
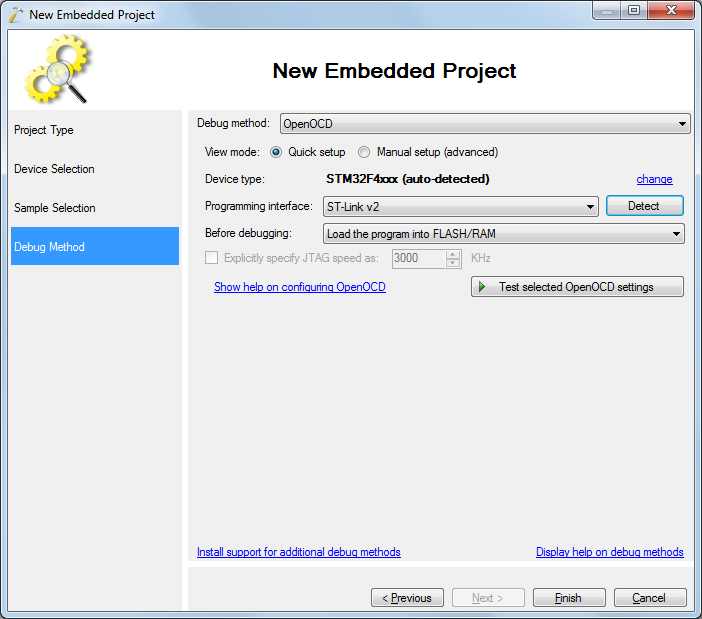
- On the last wizard page select the programming interface you want to use. The easiest option is to select OpenOCD, connect your board to the PC and click “Detect” and “Test OpenOCD Settings” to configure everything automatically:
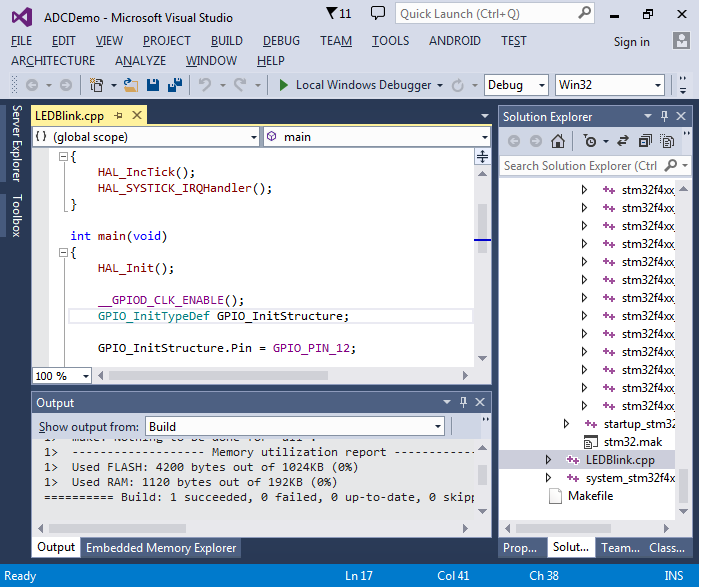
- Press Finish to create your project. Ensure that you can build it by pressing Ctrl-Shift-B:
- Before we can start using ADC, we need to configure the system clocks. You can either use the STM32CubeMX to generate a clock initialization function for you as described here, or use the following one:1234567891011121314151617181920212223242526272829static void SystemClock_Config(void){RCC_ClkInitTypeDef RCC_ClkInitStruct;RCC_OscInitTypeDef RCC_OscInitStruct;__HAL_RCC_PWR_CLK_ENABLE();__HAL_PWR_VOLTAGESCALING_CONFIG(PWR_REGULATOR_VOLTAGE_SCALE2);RCC_OscInitStruct.OscillatorType = RCC_OSCILLATORTYPE_HSE;RCC_OscInitStruct.HSEState = RCC_HSE_ON;RCC_OscInitStruct.PLL.PLLState = RCC_PLL_ON;RCC_OscInitStruct.PLL.PLLSource = RCC_PLLSOURCE_HSE;RCC_OscInitStruct.PLL.PLLM = 8;RCC_OscInitStruct.PLL.PLLN = 288;RCC_OscInitStruct.PLL.PLLP = RCC_PLLP_DIV2;RCC_OscInitStruct.PLL.PLLQ = 6;HAL_RCC_OscConfig(&RCC_OscInitStruct);RCC_ClkInitStruct.ClockType = (RCC_CLOCKTYPE_SYSCLK | RCC_CLOCKTYPE_HCLK | RCC_CLOCKTYPE_PCLK1 | RCC_CLOCKTYPE_PCLK2);RCC_ClkInitStruct.SYSCLKSource = RCC_SYSCLKSOURCE_PLLCLK;RCC_ClkInitStruct.AHBCLKDivider = RCC_SYSCLK_DIV1;RCC_ClkInitStruct.APB1CLKDivider = RCC_HCLK_DIV4;RCC_ClkInitStruct.APB2CLKDivider = RCC_HCLK_DIV2;HAL_RCC_ClockConfig(&RCC_ClkInitStruct, FLASH_LATENCY_4);SystemCoreClockUpdate();if (HAL_GetREVID() == 0x1001)__HAL_FLASH_PREFETCH_BUFFER_ENABLE();}
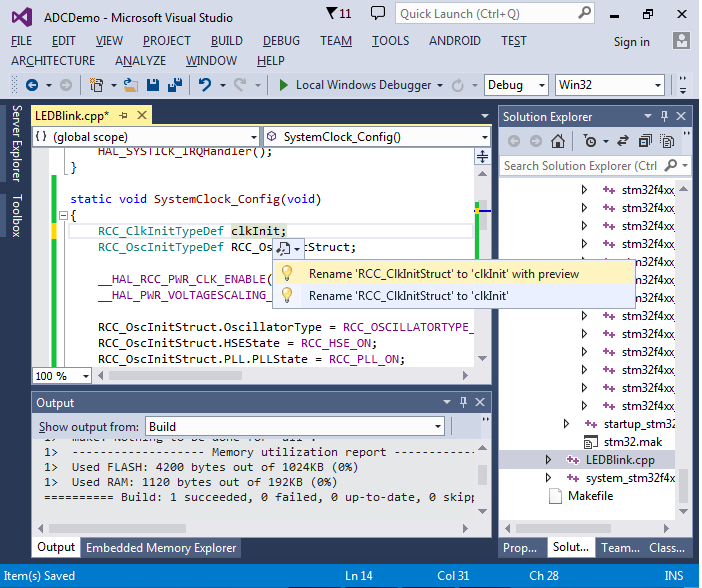
- If you want to change the naming style of the variables, simply rename the definition and use the smart tags to rename the references. As long as you are using Clang IntelliSense, this will work in all Visual Studio versions starting with VS2005:
- The easiest way to start using the ADC is to enable it in the poll mode. To do that you will need the following:
- Enable the ADC clock
- Enable the GPIO clock for the pin you want to use
- Configure the GPIO pin as an analog input
- Configure the ADC speed (prescaler/sample time)
- Enable continuous measurement mode
This can be done using the following code:
12345678910111213141516171819202122232425262728293031323334353637383940414243444546ADC_HandleTypeDef g_AdcHandle;void ConfigureADC(){GPIO_InitTypeDef gpioInit;__GPIOC_CLK_ENABLE();__ADC1_CLK_ENABLE();gpioInit.Pin = GPIO_PIN_1;gpioInit.Mode = GPIO_MODE_ANALOG;gpioInit.Pull = GPIO_NOPULL;HAL_GPIO_Init(GPIOC, &gpioInit);HAL_NVIC_SetPriority(ADC_IRQn, 0, 0);HAL_NVIC_EnableIRQ(ADC_IRQn);ADC_ChannelConfTypeDef adcChannel;g_AdcHandle.Instance = ADC1;g_AdcHandle.Init.ClockPrescaler = ADC_CLOCKPRESCALER_PCLK_DIV2;g_AdcHandle.Init.Resolution = ADC_RESOLUTION_12B;g_AdcHandle.Init.ScanConvMode = DISABLE;g_AdcHandle.Init.ContinuousConvMode = ENABLE;g_AdcHandle.Init.DiscontinuousConvMode = DISABLE;g_AdcHandle.Init.NbrOfDiscConversion = 0;g_AdcHandle.Init.ExternalTrigConvEdge = ADC_EXTERNALTRIGCONVEDGE_NONE;g_AdcHandle.Init.ExternalTrigConv = ADC_EXTERNALTRIGCONV_T1_CC1;g_AdcHandle.Init.DataAlign = ADC_DATAALIGN_RIGHT;g_AdcHandle.Init.NbrOfConversion = 1;g_AdcHandle.Init.DMAContinuousRequests = ENABLE;g_AdcHandle.Init.EOCSelection = DISABLE;HAL_ADC_Init(&g_AdcHandle);adcChannel.Channel = ADC_CHANNEL_11;adcChannel.Rank = 1;adcChannel.SamplingTime = ADC_SAMPLETIME_480CYCLES;adcChannel.Offset = 0;if (HAL_ADC_ConfigChannel(&g_AdcHandle, &adcChannel) != HAL_OK){asm(“bkpt 255”);}} - Finally replace the main() function with the following code that will continuously read the data from the ADC:12345678910111213141516171819uint32_t g_ADCValue;int g_MeasurementNumber;int main(void){HAL_Init();SystemClock_Config();ConfigureADC();HAL_ADC_Start(&g_AdcHandle);for (;;){if (HAL_ADC_PollForConversion(&g_AdcHandle, 1000000) == HAL_OK){g_ADCValue = HAL_ADC_GetValue(&g_AdcHandle);g_MeasurementNumber++;}}}
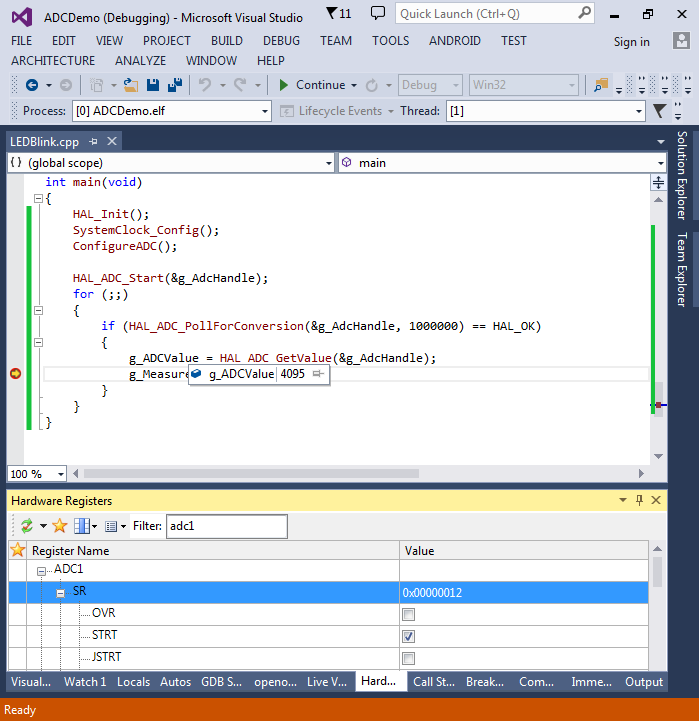
- Set a breakpoint on the line incrementing the g_MeasurementNumber variable and press F5 to start debugging. Once the breakpoint is hit, hover the mouse over “g_ADCValue” to see the measured value:
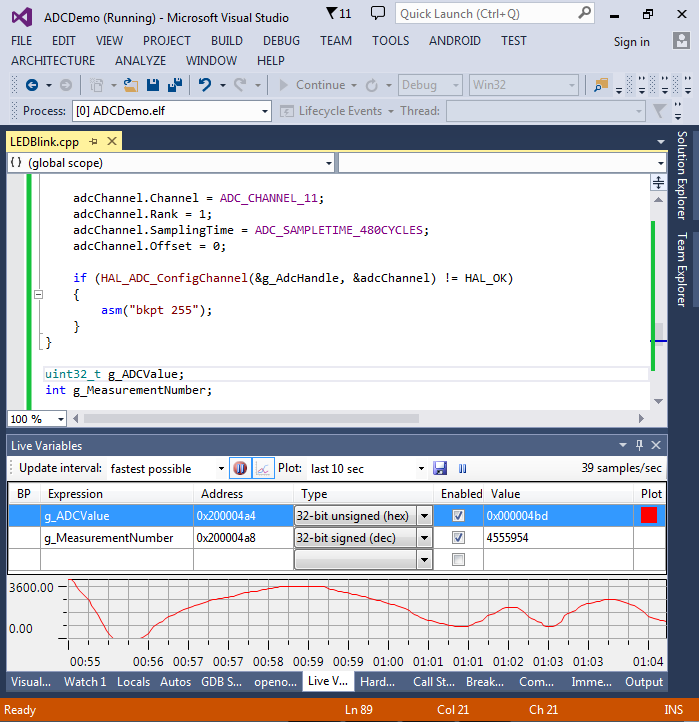
- Select Debug->Windows->Live Variables, add “g_ADCValue” and “g_MeasurementNumber” to live variable list, remove the breakpoint and press F5 to resume debugging. Then try moving the potentiometer knob and observe the plot view:You can also plot the g_MeasurementNumber variable to observe how fast the measurements are taken by the device. The settings shown in this tutorial should result in approximately 64K measurements per second.
- Reading the values in a loop is the simplest way to use the ADC, but it makes it harder to run other code while the ADC is being used. To support that, we will switch to using ADC in the interrupt-based mode. This is done by replacing HAL_ADC_Start() with HAL_ADC_Start_IT() and adding the following handler functions:123456789101112extern “C”{void HAL_ADC_ConvCpltCallback(ADC_HandleTypeDef* AdcHandle){g_ADCValue = HAL_ADC_GetValue(AdcHandle);}void ADC_IRQHandler(){HAL_ADC_IRQHandler(&g_AdcHandle);}}
- We will also modify the main() function to control the LED connected to PD12 based on the value from the ADC. E.g. if the ADC value 96, the LED will be on 96 cycles and then off for 4000 cycles, making it look very faint:1234567891011121314151617181920212223242526272829int main(void){HAL_Init();ConfigureADC();HAL_ADC_Start_IT(&g_AdcHandle);GPIO_InitTypeDef GPIO_InitStructure;__GPIOD_CLK_ENABLE();GPIO_InitStructure.Pin = GPIO_PIN_12;GPIO_InitStructure.Mode = GPIO_MODE_OUTPUT_PP;GPIO_InitStructure.Speed = GPIO_SPEED_HIGH;GPIO_InitStructure.Pull = GPIO_NOPULL;HAL_GPIO_Init(GPIOD, &GPIO_InitStructure);for (;;){int onTime = g_ADCValue;int offTime = 4096 – onTime;HAL_GPIO_WritePin(GPIOD, GPIO_PIN_12, GPIO_PIN_SET);for (int i = 0; i < onTime; i++)asm(“nop”);HAL_GPIO_WritePin(GPIOD, GPIO_PIN_12, GPIO_PIN_RESET);for (int i = 0; i < offTime; i++)asm(“nop”);}}
- Build and run your program. Ensure that the perceived LED brightness changes when you turn the knob. Then set a breakpoint in the HAL_ADC_ConvCpltCallback function:
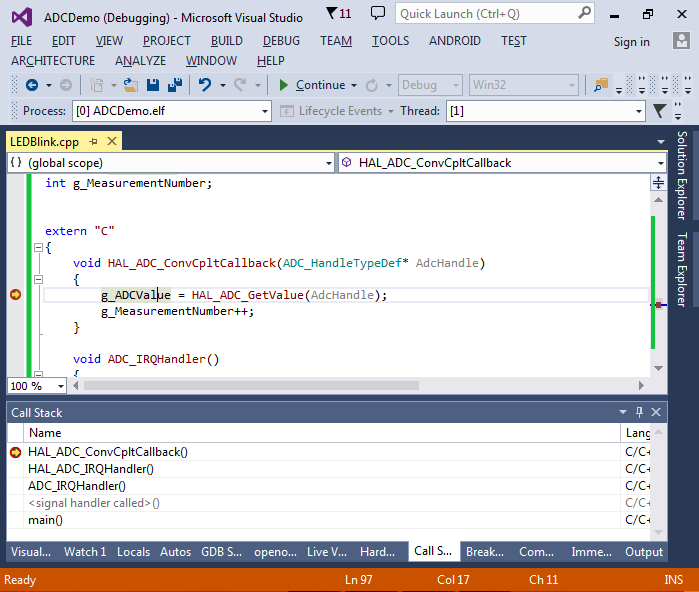
- From looking at the functions in the call stack and the HAL_ADC_Start_IT() function we can understand how the interrupt mechanism works:
- When you call HAL_ADC_Start_IT() it calls __HAL_ADC_ENABLE_IT() to enable the overrun and end-of-conversion interrupts
- When we call HAL_NVIC_EnableIRQ(), it enables the ADC IRQ in the interrupt controller
- When the ADC conversion is complete, it sets the EOC bit in the ADC1_SR register.
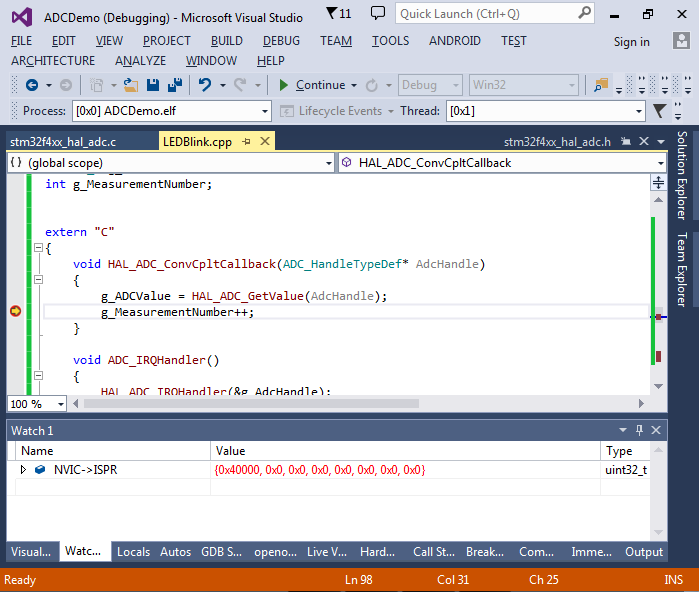
- As the end-of-conversion interrupt was enabled, ADC signals the interrupt to the interrupt controller. The corresponding bit in the NVIC->ISPR register is set.
- As we have enabled the ADC interrupt, the ARM Cortex core invokes the ADC_IQRHandler() function that in turn calls HAL_ADC_IRQHandler() that reads the value from the ADC and calls HAL_ADC_ConvCpltCallback().
If the callback is not invoked in your code, use the list above to check whether the end-of-conversion event occurs and whether it is propagated to the interrupt controller.
- Now we will try to raise the ADC performance. Replace ADC_SAMPLETIME_480CYCLES with ADC_SAMPLETIME_28CYCLES and start debugging. You will notice that the loop in main() is never executed. You can use the debugger to find out that by the time the ADC value is read, the next ADC interrupt is already pending:
- This happens because the ADC reads new values faster than our code can handle. To speed this up, we will now use the DMA to get the ADC automatically write values into a buffer in RAM and only call the CPU when the entire buffer is written. According to the STM32F4 reference manual, ADC1 is connected to channel 0 of streams 0 and 4 of DMA2:
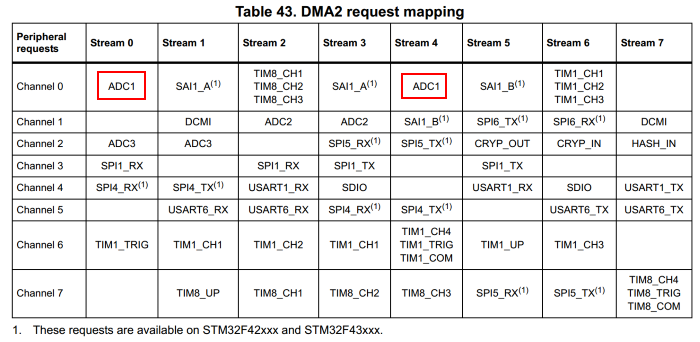 In this example we will use channel 0 of stream 4.
 - Before we can start using the DMA, we need to configure it. Add the following code to your program:123456789101112131415161718192021222324252627DMA_HandleTypeDef g_DmaHandle;void ConfigureDMA(){__DMA2_CLK_ENABLE();g_DmaHandle.Instance = DMA2_Stream4;g_DmaHandle.Init.Channel = DMA_CHANNEL_0;g_DmaHandle.Init.Direction = DMA_PERIPH_TO_MEMORY;g_DmaHandle.Init.PeriphInc = DMA_PINC_DISABLE;g_DmaHandle.Init.MemInc = DMA_MINC_ENABLE;g_DmaHandle.Init.PeriphDataAlignment = DMA_PDATAALIGN_WORD;g_DmaHandle.Init.MemDataAlignment = DMA_MDATAALIGN_WORD;g_DmaHandle.Init.Mode = DMA_CIRCULAR;g_DmaHandle.Init.Priority = DMA_PRIORITY_HIGH;g_DmaHandle.Init.FIFOMode = DMA_FIFOMODE_DISABLE;g_DmaHandle.Init.FIFOThreshold = DMA_FIFO_THRESHOLD_HALFFULL;g_DmaHandle.Init.MemBurst = DMA_MBURST_SINGLE;g_DmaHandle.Init.PeriphBurst = DMA_PBURST_SINGLE;HAL_DMA_Init(&g_DmaHandle);__HAL_LINKDMA(&g_AdcHandle, DMA_Handle, g_DmaHandle);HAL_NVIC_SetPriority(DMA2_Stream4_IRQn, 0, 0);HAL_NVIC_EnableIRQ(DMA2_Stream4_IRQn);}
Note the Mode parameter. If you set it to DMA_NORMAL, you would need to start another DMA transfer by calling HAL_ADC_Start_DMA() each time a transfer is completed. And if you don’t do it fast enough, you will get an ADC overrun error and lose some ADC samples. In this example we set it to DMA_CIRCULAR so when the DMA controller is done filling the buffer it will restart from the beginning the moment it receives a new value from the ADC.
Note: if you get a build error stating that DMA2_Stream4_IRQn is undefined, try using DMA2_Channel4_IRQn instead. Some device families may also require the following code in your SystemClock_Config() function:
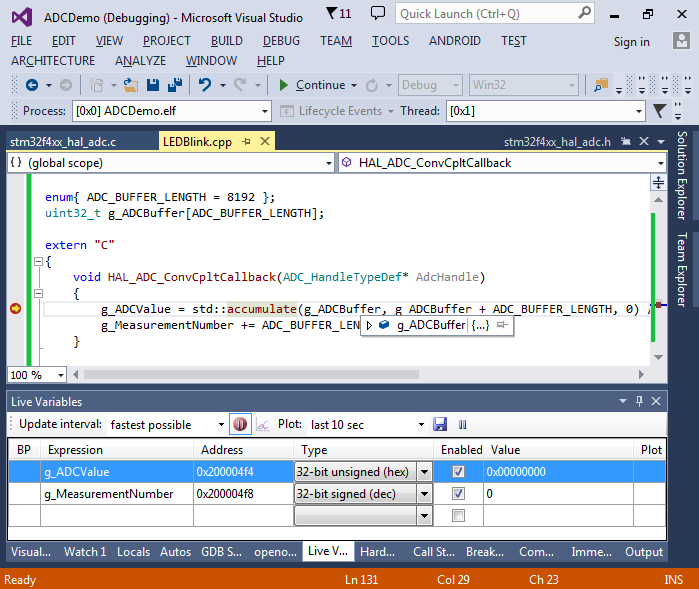
1234RCC_PeriphCLKInitTypeDef periphClockConfig;HAL_RCCEx_GetPeriphCLKConfig(&periphClockConfig);periphClockConfig.Adc12ClockSelection = RCC_ADC12PLLCLK_DIV1;HAL_RCCEx_PeriphCLKConfig(&periphClockConfig); - Define a global array called g_ADCBuffer and modify the HAL_ADC_ConvCpltCallback() function to compute the average value from the array instead of polling the last value from the ADC:1234567891011121314151617181920212223#includeenum{ ADC_BUFFER_LENGTH = 8192 };uint32_t g_ADCBuffer[ADC_BUFFER_LENGTH];extern “C”{void HAL_ADC_ConvCpltCallback(ADC_HandleTypeDef* AdcHandle){g_ADCValue = std::accumulate(g_ADCBuffer, g_ADCBuffer + ADC_BUFFER_LENGTH, 0) / ADC_BUFFER_LENGTH;g_MeasurementNumber += ADC_BUFFER_LENGTH;}void DMA2_Stream4_IRQHandler(){HAL_DMA_IRQHandler(&g_DmaHandle);}void ADC_IRQHandler(){HAL_ADC_IRQHandler(&g_AdcHandle);}}
- Finally replace the call to HAL_ADC_Start_IT() in main() with the following code:12ConfigureDMA();HAL_ADC_Start_DMA(&g_AdcHandle, g_ADCBuffer, ADC_BUFFER_LENGTH);
- Now you can start your program and see that it is no longer spending all its time in the interrupt handler, as the handler is now only invoked once for every 8192 ADC values. Set a breakpoint in the HAL_ADC_ConvCpltCallback() function and wait until it is hit:
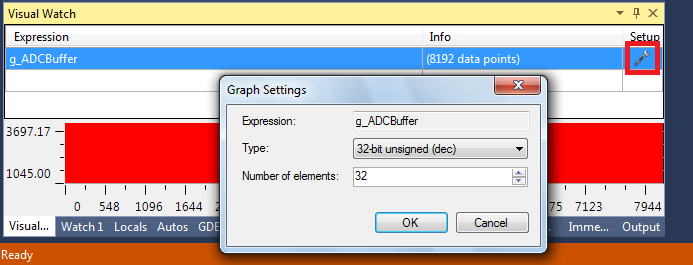
- Select Debug->Windows-Visual Watch and add g_ADCBuffer to the Visual Watch window:
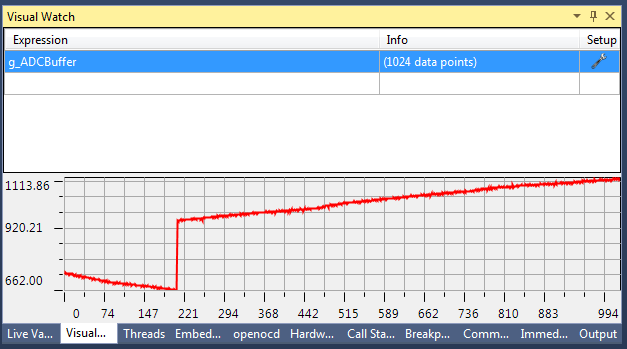
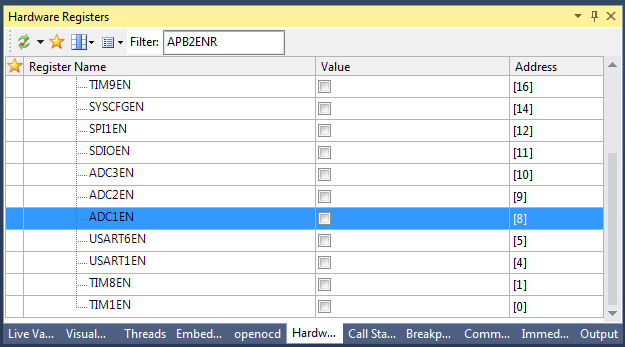
- This will visualize the contents of the buffer filled by ADC. Note that it may have a jump in it as the will ADC keep on running in the background and updating the buffer even while the program is stopped in the debugger. You can avoid it by manually disabling the ADC clock via the Hardware Registers window:
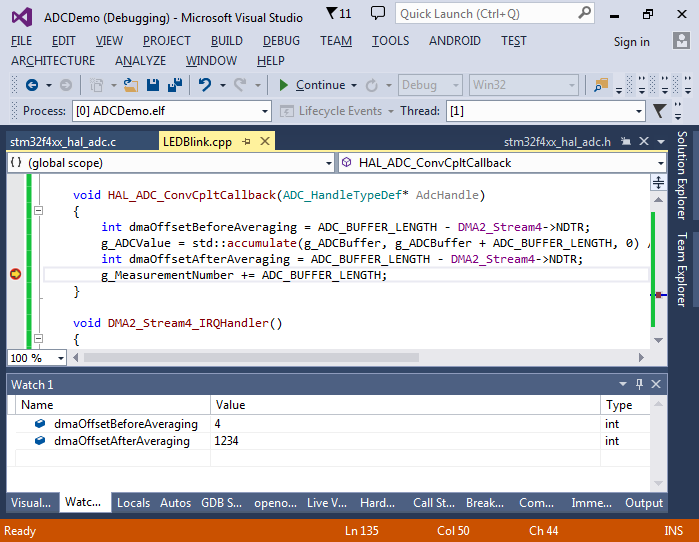
- You can get an idea of the DMA timings by saving the value of the NDTR register from the DMA stream at different points in your HAL_ADC_ConvCpltCallback() function:1234567void HAL_ADC_ConvCpltCallback(ADC_HandleTypeDef* AdcHandle){int dmaOffsetBeforeAveraging = ADC_BUFFER_LENGTH – DMA2_Stream4->NDTR;g_ADCValue = std::accumulate(g_ADCBuffer, g_ADCBuffer + ADC_BUFFER_LENGTH, 0) / ADC_BUFFER_LENGTH;int dmaOffsetAfterAveraging = ADC_BUFFER_LENGTH – DMA2_Stream4->NDTR;g_MeasurementNumber += ADC_BUFFER_LENGTH;}
Note that the NDTR register contains the remaining amount of values, not the transferred amount.
- In our example, by the time we start computing the average value of the measurements, the DMA controller has already overwritten 4 first values in the buffer with new values and by the time we end averaging it has filled 1234 values:
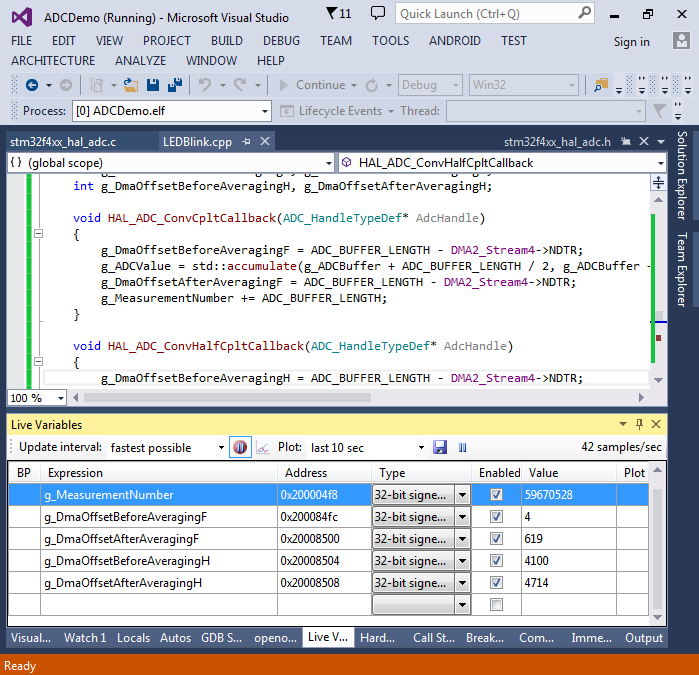
- Although this is not critical for the averaging example, it may become a problem if we are interested in precise data. This can be solved by defining the HAL_ADC_ConvHalfCpltCallback()handler that will be invoked once the DMA controller fills half of the buffer. We will then process the first half of the buffer while the second half is being filled and vice versa:123456789101112131415161718int g_DmaOffsetBeforeAveragingF, g_DmaOffsetAfterAveragingF;int g_DmaOffsetBeforeAveragingH, g_DmaOffsetAfterAveragingH;void HAL_ADC_ConvCpltCallback(ADC_HandleTypeDef* AdcHandle){g_DmaOffsetBeforeAveragingF = ADC_BUFFER_LENGTH – DMA2_Stream4->NDTR;g_ADCValue = std::accumulate(g_ADCBuffer + ADC_BUFFER_LENGTH / 2, g_ADCBuffer + ADC_BUFFER_LENGTH, 0) / (ADC_BUFFER_LENGTH / 2);g_DmaOffsetAfterAveragingF = ADC_BUFFER_LENGTH – DMA2_Stream4->NDTR;g_MeasurementNumber += ADC_BUFFER_LENGTH;}void HAL_ADC_ConvHalfCpltCallback(ADC_HandleTypeDef* AdcHandle){g_DmaOffsetBeforeAveragingH = ADC_BUFFER_LENGTH – DMA2_Stream4->NDTR;g_ADCValue = std::accumulate(g_ADCBuffer, g_ADCBuffer + ADC_BUFFER_LENGTH / 2, 0) / (ADC_BUFFER_LENGTH / 2);g_DmaOffsetAfterAveragingH = ADC_BUFFER_LENGTH – DMA2_Stream4->NDTR;g_MeasurementNumber += ADC_BUFFER_LENGTH;}
- Check the newly added global variables to ensure that the first half of the buffer is processed while the second half is being modified and vice versa:
- One last thing we will show in this tutorial is how to configure ADC to automatically interleave data from several channels. Change the ConfigureADC() function to set ScanConvMode = ENABLE and NbrOfConversion=2. Then add the following code after the call to HAL_ADC_ConfigChannel():123456789adcChannel.Channel = ADC_CHANNEL_16;adcChannel.Rank = 2;adcChannel.SamplingTime = ADC_SAMPLETIME_480CYCLES;adcChannel.Offset = 0;if (HAL_ADC_ConfigChannel(&g_AdcHandle, &adcChannel) != HAL_OK){asm(“bkpt 255”);}
Specifying Rank = 2 means that the newly added channel 16 (converted to a temperature sensor on STM32F407VG) will be converted after the channel 11 with rank 1.
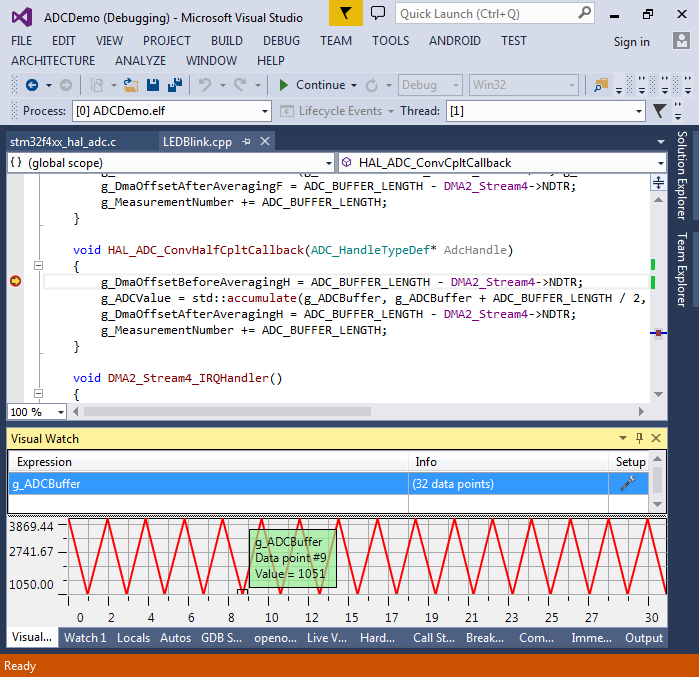
- Set a breakpoint in HAL_ADC_ConvHalfCpltCallback() and start debugging. Once the breakpoint is hit, click in the “Setup” field of the g_ADCBuffer visual watch and set the length to 32:
- This will zoom the graph to clearly show that every even point is taken from the potentiometer channel and every odd point is taken from the internal temperature sensor and does not change when we rotate the knob: